




Last updated: Rules, fees and platform policies change. This guide is reviewed and kept current.
The revenue chart in your marketplace dashboard is going up, but at the end of the month the money you expected is not in the bank. This is e-commerce’s most common and most expensive misconception: mistaking revenue growth for profit. The problem is usually not sales volume; it is not knowing how much each product actually earns.
In this post we will build a unit economics table that produces the real profit on a single order. Knowing your product’s price is not enough; you need to see commission, shipping, returns, advertising and a share of fixed costs in the same table.
A note for international readers: the figures here are in Turkish lira (TRY) and the examples come from Turkish marketplaces such as Trendyol and Hepsiburada. “KDV” is Turkish VAT, and “desi” is the volumetric weight unit Turkish carriers price by. The method itself applies to any marketplace anywhere.
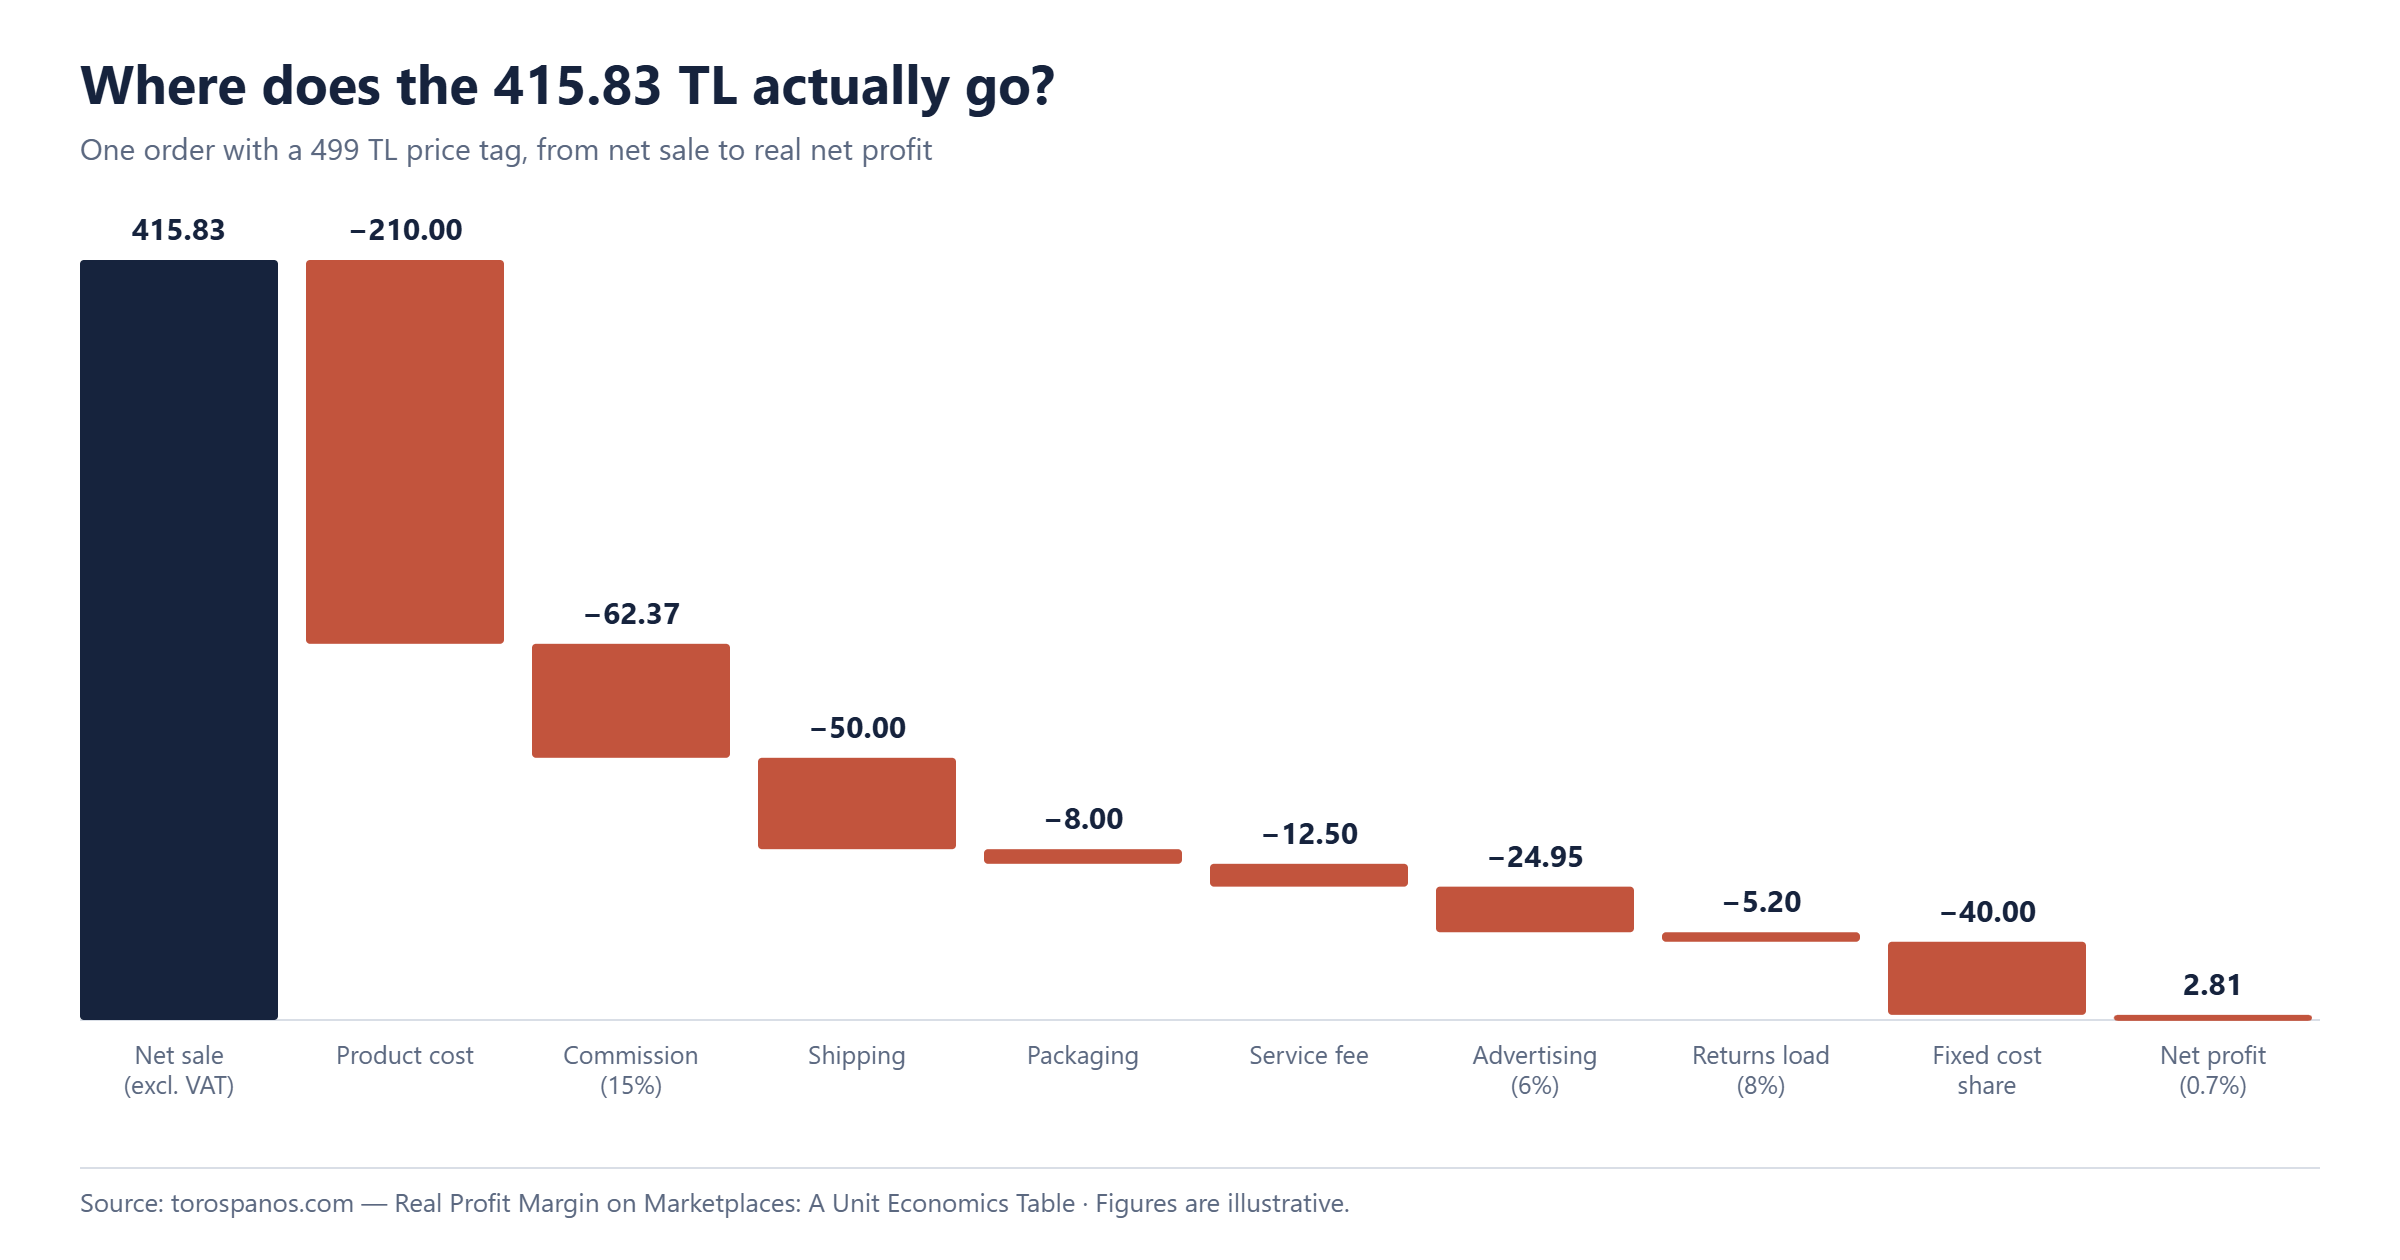
| Item | Amount (TL) | Remaining (TL) |
|---|---|---|
| Net sale (excl. VAT) | 415.83 | 415.83 |
| Product cost | −210.00 | 205.83 |
| Commission (15%) | −62.37 | 143.46 |
| Shipping | −50.00 | 93.46 |
| Packaging | −8.00 | 85.46 |
| Service fee | −12.50 | 72.96 |
| Advertising (6%) | −24.95 | 48.01 |
| Returns load (8%) | −5.20 | 42.81 |
| Fixed cost share | −40.00 | 2.81 |
| Net profit (0.7%) | 2.81 |
Why most sellers calculate margin wrong
The classic calculation goes like this: “I buy the product for 210 lira, I sell it for 499, the difference is mine.” That calculation has three blind spots.
- Variable costs are invisible. Commission, shipping, packaging, payment and service fees: each one falls on the individual order, and some of them rise as the price rises.
- The cost of returns is written down nowhere. A returned order is not simply “unsold”; you also carry the outbound and inbound shipping, the crushed packaging, and the labour of making that product sellable again.
- Fixed costs are not allocated to orders. Warehouse rent, staff, accounting and software subscriptions are treated as monthly expenses and never placed next to product profit.
The result: you think you are working on a 25% margin on paper while in reality you are selling at close to zero, and on some products at a negative margin. Worst of all, you end up pushing your advertising budget into exactly those loss-making products.
The rows of the unit economics table
Turn the sequence below into a table, one row per product, one column per cost. The order of the columns matters, because at each stage you are answering a separate question: what is left after this particular cost?
- Selling price: what the customer pays, VAT included.
- VAT: not your money, the state’s. Separate it out first.
- Product cost: the purchase price; if you import, include customs and freight in product cost.
- Marketplace commission: varies by category and can change during campaign periods. Use the current rate in your own dashboard; do not estimate.
- Shipping: the real contracted price for your volumetric weight band. “Free shipping” is not free for you.
- Packaging: box, filler, tape, labels. Small per item, large when multiplied by order count.
- Service and transaction fees: the marketplace’s fixed per-order fee, virtual POS and installment commissions, integration charges.
- Advertising: ad spend per product. Rather than dividing total ad spend by total orders, measure it per product wherever you can.
- Return impact: return rate multiplied by loss per return. This row is almost never written down, and it usually delivers the nastiest surprise.
- Share of fixed costs: total monthly fixed costs divided by monthly order count.
An example: fine on paper, critical in reality
To keep the numbers easy to follow I am working with VAT-excluded amounts. The prices are illustrative; put your own dashboard’s real values in.
- Selling price: TRY 499 (VAT included) → net sale excluding VAT: TRY 415.83
- Product cost: TRY 210.00
- Commission (15%): TRY 62.37
- Shipping: TRY 50.00
- Packaging: TRY 8.00
- Service / transaction fee: TRY 12.50
- Advertising (6% of net sale): TRY 24.95
Total variable cost: TRY 367.82. Remaining contribution: TRY 48.01, or 11.5%. So far it looks fine.
Now add returns. If the return rate is 8% and each return costs TRY 65 in round-trip shipping, packaging and handling, that is an average additional burden of TRY 5.20 per order. Contribution falls to TRY 42.81, or 10.3%.
Last row: if fixed costs are TRY 60,000 a month and you ship 1,500 orders a month, that is TRY 40 per order. Real net profit: TRY 2.81. That is 0.7%.
Same product, same table. Just by adding two rows, the description “a good product with an 11.5% margin” turned into “a product that makes no money unless I increase volume”. Those two rows are what change your decisions.
Four levers for improving margin
1. Shipping and volumetric weight
Shrinking the packaging is the fastest win for most sellers. Dropping one volumetric weight band means tens of lira per order; across 1,500 orders that is a serious line item. Test packaging alternatives that reduce volume without reducing how well the product is protected.
2. Return rate
Categorise the reasons for returns: size and fit, different from expected, damaged, change of mind. Size and “different from expected” can be solved on the product page — a clearer size table, photographs shot in real light, material detail. Damaged returns point at a packaging problem.
3. Price and basket size
Raising the price outright is not always possible, but spreading the per-order fixed costs (shipping, packaging, transaction fees) across a bigger basket is. That is exactly why multipacks, complementary product recommendations and a free-shipping threshold touch margin directly.
4. Bringing advertising down to product level
If you track ad spend as a store average, you are using the earnings of profitable products to finance loss-making ones. Without per-product ad spend and conversion data you cannot decide which campaign to cut.
A 30-minute routine, once a month
Building this table once is not enough; costs move. At the start of every month, run these three steps:
- Put your 20 best-selling products through the table with current commission, shipping and advertising data.
- Flag the products whose net margin is negative or below 2%. Decide for each one: price, packaging, cut the advertising, or delist.
- Put the products whose return rate is double your average on a separate list. These are the items quietly leaking money.
This half-hour routine surfaces, on the first pass, losses most sellers do not notice for months. In e-commerce, scale also scales the loss on an unprofitable product — so make sure the table is right before you grow.
Note: the rates in this post are examples. Work with your accountant on VAT offsetting and bookkeeping.
Turning the table into a decision tool
When the calculation is done, what you hold should not be a report but a decision list. Split the products into four groups by net margin:
- Stars (net margin above 8%): shift the advertising budget here and never let them go out of stock. Running out of these is a direct loss of profit.
- Volume products (2–8%): they do not earn much on their own, but they cover fixed costs and feed your store rating. The work here is cost reduction.
- Leaks (0–2%): you are working almost for free on every sale. This is where you decide on a price increase, a packaging change, or cutting the advertising entirely.
- Loss makers (negative): stop the advertising immediately. If you are running a deliberate campaign to clear stock, fine — but do it knowing it is a strategy, not an accident.
Three common mistakes
Trusting averages. You may well be running at a 9% margin store-wide; that hides the fact that half your products are losing money. The decision is made at product level.
Not putting campaign discounts into the table. If you do not account for how much of the discount burden you carry in marketplace campaigns, the day you break a revenue record can be the day you lose the most money.
Not counting your own labour as a cost. If you pack the orders yourself, that is not free; put a value on your own hour and add it to the fixed cost row. Otherwise the cost of the person you hire as you grow comes as a surprise.
Related reading
- To steer the advertising budget to the right products once the margin table is built: Google Performance Max: seven control steps for e-commerce.
- A practical way to analyse return reasons with data: AI automation in small e-commerce.
Sources and official links
- Amazon Türkiye — Fees (Turkish market) — Category-level commission and storage fee schedule for the Turkish market
- Amazon Seller Central — Referral fees — How the referral fee is calculated and which amounts are excluded
- Amazon Seller Central — FBA fulfillment fee — How the per-unit pick-and-pack fee varies by size and weight
- Turkish Revenue Administration — VAT General Implementation Communiqué — Where VAT sits in the unit economics table and how refunds work
- Official Gazette — Regulation on e-commerce intermediary and e-commerce service providers — Marketplace payment terms to sellers and limits on unfair commercial practices
Rules, fee schedules and platform policies change. The figures in this post reflect the position at the time of writing; confirm the current position from the official sources above before you act.
Haftalık bülten
Pazaryeri ve e-ihracatta bu hafta ne değişti?
Komisyon oranları, mevzuat ve algoritma değişikliklerini haftada bir, tek e-postada özetliyorum. Reklam yok, tekrar yok — istediğiniz an tek tıkla çıkabilirsiniz.
